

The 90-day reprieve on tariffs that was announced on April 25 came to an end last week (beginning of July). So far, just three trade deals have been agreed on (well, sort of agreed).
 The Trump Administration has now unilaterally imposed new tariff levels on most of its main trading partners, and quite a few others too.
 Here’s a rundown on where things stand:
The August 1 Deadline: The administration has set a new deadline for pending deals, after which new tariffs will go into effect… unless there’s another extension.
 Who is in the Crosshairs? As of July 9, the following tariff rates had been announced.
20%:Â Philippines
25%:Â Japan, South Korea, Malaysia, Kazakhstan, Brunei, Moldova,
30-32%:Â South Africa, Indonesia, Bosnia, Algeria, Iraq, Libya
35-40%:Â Bangladesh, Serbia, Laos, Myanmar
50%:Â Brazil – for all the reasons mentioned earlier.
The China Situation:Â China, alongside the UK and Vietnam, has negotiated a separate deal to reduce the pain from this specific round of tariffs. However, tensions with China remain high, with a baseline 10% tariff in place and higher rates (up to 35%) on specific goods linked to issues like intellectual property theft.
Europe:Â The EU is seeking to conclude a preliminary trade deal right now which would allow it to lock in a 10% tariff rate beyond 1 August.
These tariffs are in addition to any existing duties. It’s crucial to understand that these tariffs stack on top of one another, compounding the cost of imported goods.
Trump has also threatened to impose a 200% tariff on pharmaceutical imports, and 50% on copper. In response, copper futures hit a record high as traders anticipated stockpiling ahead of the increase.
 Most countries are facing substantial tariffs, which will affect their exporters. For the US importers, the tariffs imposed on key trading partners are most relevant, South Korea and Japan.
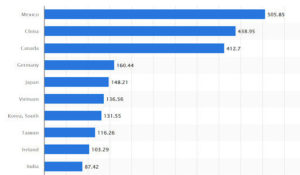
Largest US Trade Partners by Import Value (2024) – Statista
OBBB is arguably the largest tax and spending package in US history. It’s a bold attempt to stimulate the economy, but it comes with a hefty price tag.Â
The bill will have a direct impact on certain industries, with quite a few winners and a few losers.Â
The key features of the bill aren’t a surprise, but there are some details worth noting.
 These are the most important provisions:
- Tax Cuts:Â The bill makes the 2017 tax cuts permanent and prevents the scheduled tax hike, which provides relief to corporations and households. It also eliminates federal taxes on tips and overtime pay, though this is capped.
- Consumer spending should benefit from new tax relief for middle-income groups.
- Corporate profits benefit from the lower tax rate.
- New tax incentives:Â The bill is over 1000 pages and includes numerous tax incentives for businesses and households.
-  Real estate investors can fully depreciate certain expenditures in the first year. This provision has been reinstated and extended to 2029.
- In addition, Qualified Opportunity Zones offer tax incentives from 2027 to 2033 for investment in rural areas. Low-income developments also offer incentives.
- Semiconductor manufacturers have been incentivised to build capacity in the US quickly. Companies that break ground on new fabs by 2026 are eligible for up to 35% in tax credits.
- Manufacturing companies in general are being incentivised to reshore and create new jobs.
Tariffs on imports like steel and copper could dampen the positive effect of these incentives.
Government priorities
The bill allocates massive funds to administration priorities, including $178 billion for immigration enforcement and $153 billion for defence, focusing on shipbuilding and nuclear modernisation.Â
Defence & Aerospace contractors are the obvious beneficiaries of these investments. Infrastructure, construction, and materials companies also stand to benefit – if they operate in the right areas.
The increase in spending could result in elevated inflation.
The Inflation Reduction Act will be terminated, and renewable energy credits will be phased out.
 Renewable energy companies are on the wrong side of this, but this was anticipated. Utilities will face higher CapEx costs without the incentives and longer build times to bring new capacity to the grid. Consumers are likely to face higher electricity prices as capacity growth slows. Oil and gas producers benefit from new incentives, and a less competitive renewables industry.Â
The direction of oil and gas prices could overshadow these benefits.
Medicare and Medicaid Cuts are projected to be over $1.5 trillion combined. Many of the cuts and increased work requirements only come into effect in 2026 and 2027, so their effects will be delayed.Â
Hospitals and insurers will be on the wrong side of these cuts unless consumers are able to make up shortfalls.
The Consumer Financial Protection Bureau will see a 50% cut in funding.
Lenders and other financial services companies could benefit from lower regulatory costs. This could also lead to heightened systemic risk.
The recent performance of US sectors gives us some ideas of how the market views the passing of the OBBB:
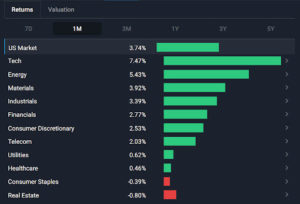
US Sector One-Month Performance – Simply Wall St
The Long Term: A Mountain of Debt
 While supporters focus on growth, economists and budget analysts are sounding the alarm on the fiscal impact.
Deficit Explosion: The Congressional Budget Office (CBO) projects the bill will add $3.4 to $5 trillion to the national debt over the next decade.
The “Debt Bomb”: Veteran investor Ray Dalio has warned that this trajectory risks a “debt bomb” scenario, where the sheer volume of debt destabilises the US dollar and heightens global financial risk. By 2035, estimates indicate the U.S. gross federal debt-to-GDP ratio could hit nearly 155%.
The theory behind increased spending is that it will lead to higher economic growth, and therefore higher tax revenues despite the lower tax rates.Â
 Well, that’s the theory at least. Many economists don’t see growth being high enough to pay for the increase in debt. Others argue that the only way out is growth.
 Global bond investors may be beginning to signal when they think US debt will become a real problem. The gap between 30-year and 10-year US treasury yields has gradually widened over the last 12 months, which can be seen below.
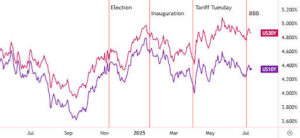
US 30-yr vs 10-yr yields – TradingView
It’s a little more complicated than the chart suggests:
Bond yields are also affected by the maturities being sold by the US Treasury.
- 🤷 Bond investors don’t (currently) have many alternatives.
- If this story unfolds badly, it won’t be a problem isolated to the US, as it could lead to extreme volatility for the US$, interest rates, and inflation around the world.Â
 That might not happen for years, but it’s something to be aware of when making decisions about long-term investments.
 Is The US Exceptionalism Premium Under Threat?Â
 A year ago, we wrote about the ‘US exceptionalism premium’, which is one way to explain the outperformance of US stocks and the gap between US and non-US company valuations.
 So, given the underperformance of US stocks in 2025, is that premium beginning to erode? Looking back at that article now, most of the catalysts we listed that created the premium are still pretty much intact, particularly in relative terms.
 But what about the debt? The U.S. government’s gross federal debt currently stands at about 124% of GDP, and it’s set to rise even higher.
 The other major economy with more debt relative to its GDP is Japan at 216%, down from a high of 225%. Japan’s debt reached 100% of GDP in 2001 and 200% in 2013. During most of that period, the Nikkei 225 index remained in a bear market.
 The prolonged bear market and rising debt were both due to a deflationary environment and very low growth. If that were to happen in the US, it would likely be bad news for a lot of US companies.Â
The important differences are:
For now, inflation is more likely in the US.
The companies that dominate US indexes are globally diversified.