Prioritising reducing debt by cutting spending and infrastructure investment is especially dangerous in a tough recession such as we have been mired in, writes independent policy analyst Susan St John

At budget time in 2024 I wrote in The Daily Blog Will the true debt figure please stand up. One year on, the issue of how we should measure the government’s debt remains far from resolved. Why does it matter?
It matters because ‘lowering the debt’ has become a symbol of government’s fiscal rectitude: a fetish based on a narrow concept that has taken the place of thinking about what it means for people.
Our Minister of Finance is upfront with her limited aspirations:
Our Government’s goal is to put net core Crown debt on a downward trajectory towards 40 per cent of GDP and in the longer term keep it below that percentage.
While government is not like a household and should not be viewed with that lens, it is helpful to relax that caveat for a minute. When a person borrows, they have gross debt. But let’s say they also have money in the bank and a stack of shares and bonds that can easily be sold. Net debt that accounts for these financial assets is a better indicator of the person’s financial health. Likewise, some of the loans may be for a car or a home so there are offsetting real assets that puts debt into perspective. Or maybe there is a student loan that has financed acquiring skills that will allow a person to earn more in the future. The context of the broader picture is everything.
Contrary to the impression the current political debate gives, the NZ Government has a strong balance sheet. Debt is only one part of the story. The value of assets greatly exceeds liabilities (largely debt).
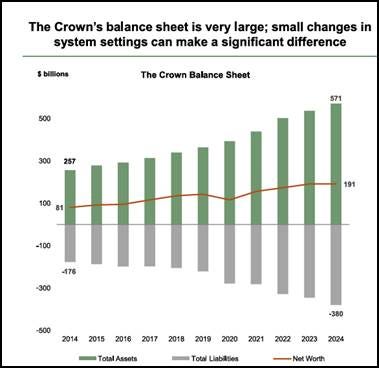
The difference (assets minus debt) is net worth and is very substantial as shown by the middle red line in this graph. As at the 30th June 2024 net worth is $191 billion (recent Treasury presentation).
If your political interests lie in reducing the size of the state, it helps if the public can be persuaded that debt is out of control. There are several ways to do this. The first is to wrongly compare government to a household, for example, the analogy of a household living off its credit card. The average person knows that ends badly. The second is to ignore reasons debt has increased; events such as global financial crises, earthquakes, floods, and a once in a century pandemic as well as purchases of financial assets for the New Zealand Super Fund. The third is to choose a manufactured debt figure that makes the situation look much worse than it is.
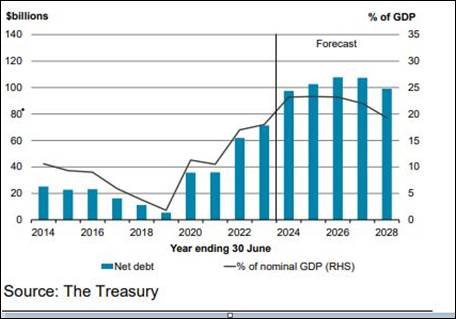
Surely government debt needs to be seen in the context of overall government’s assets. In the 2023 budget, financial assets including assets in the NZ Super fund, were netted off to show the growth in net debt as shown in the first graph below. From about $15 billion in 2019 or 5% of GDP net debt was projected to become nearly $100 billion by 2024 or 25% of GDP.
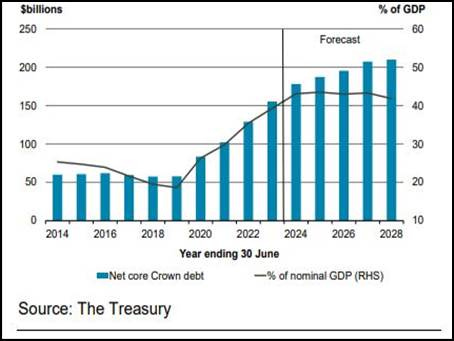
By the 2024 budget however, (second graph), a different measure of the net debt called net core Crown debt was adopted. This measure excludes the assets of the NZ Super Fund and the debt grows from 20% to 45% of GDP over the same time period.
Net Debt Budget 2023
Net Core Crown Debt Budget 2024
Let’s see what Nicola Willis is saying prebudget 2025
The previous Government’s spending decisions during and after Covid have left New Zealand with a sea of debt and red-ink in the government finances.…To give you some further historical context, New Zealand’s net core Crown debt, which once hovered between five and 25 per cent of GDP, rose to around 42 per cent last year.
Surely she did not conflate the two different measures? Perhaps she was harking back to the post financial crisis period 2008-2013 when Core Crown net debt did rise steadily from 5% to 25%– (scarcely a ‘hovering’). Here is the long time series that shows the two different measures of debt (source, Bill Rosenberg, Treasury time series).
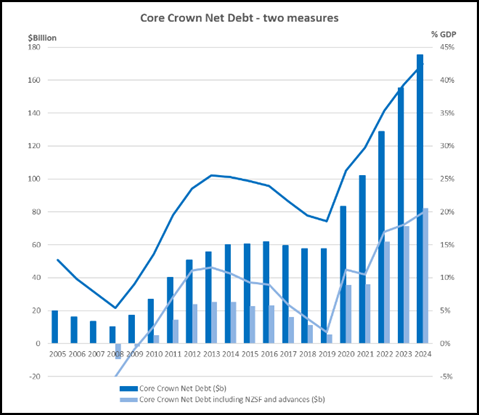
The right had side of this graph gives the debt as a percentage of GDP (blue lines). For 2024, rather than point to the 42%, we should be using the lower figure of 20%.
Compared to other countries are we really a basket case? The IMF uses a net public debt measure that includes the assets in sovereign wealth funds like the NZ Super Fund, to produce international comparisons. They show NZ in a very favourable light as having one of the lowest net debt ratios across the OECD.
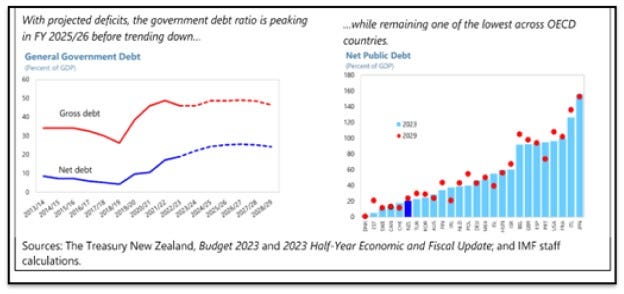
Over the years taxpayers have invested in the NZ Super Fund, often even borrowing, ie increasing gross debt, to do so. It has had a huge opportunity cost and presents a significant sacrifice by the working age population for example, resulting in reduced spending on maintaining and building infrastructure). But, even so, the coalition government decided not to give us any credit for this in their net debt measure. Today there is the significant sum of about $76 billion (20% of GDP) in the fund.
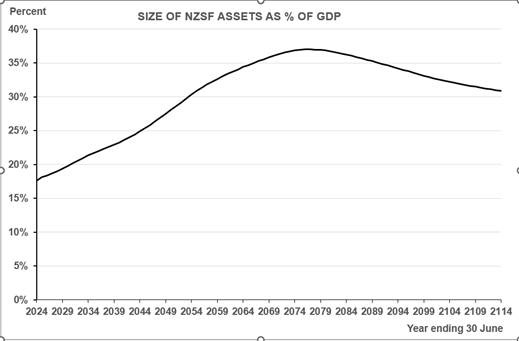
The NZ Super Fund assets are projected by Treasury (2024) to rise to over 30% of GDP mid-century (middle line in graph below) and so become an even bigger contributor to our economic security. Why is this ignored? If they are accounted for, even by mid century we will have a very low net debt of around 20% GDP.
The focus in budget 2025 is on reducing the debt by balancing the budget though spending cuts. Austerity measures in recessions are extremely damaging to the social fabric. As the economy contracts tax revenue falls further, skilled workers depart, and social spending on unemployment rises. Instead, we urgently need a virtuous circle of investment in the health and wellbeing of our working age population to stimulate the recovery and improve the capacity of the workforce.
Original post on Susan’s SubStack: Same old story—let’s frighten the horses with the bogey of net debt


